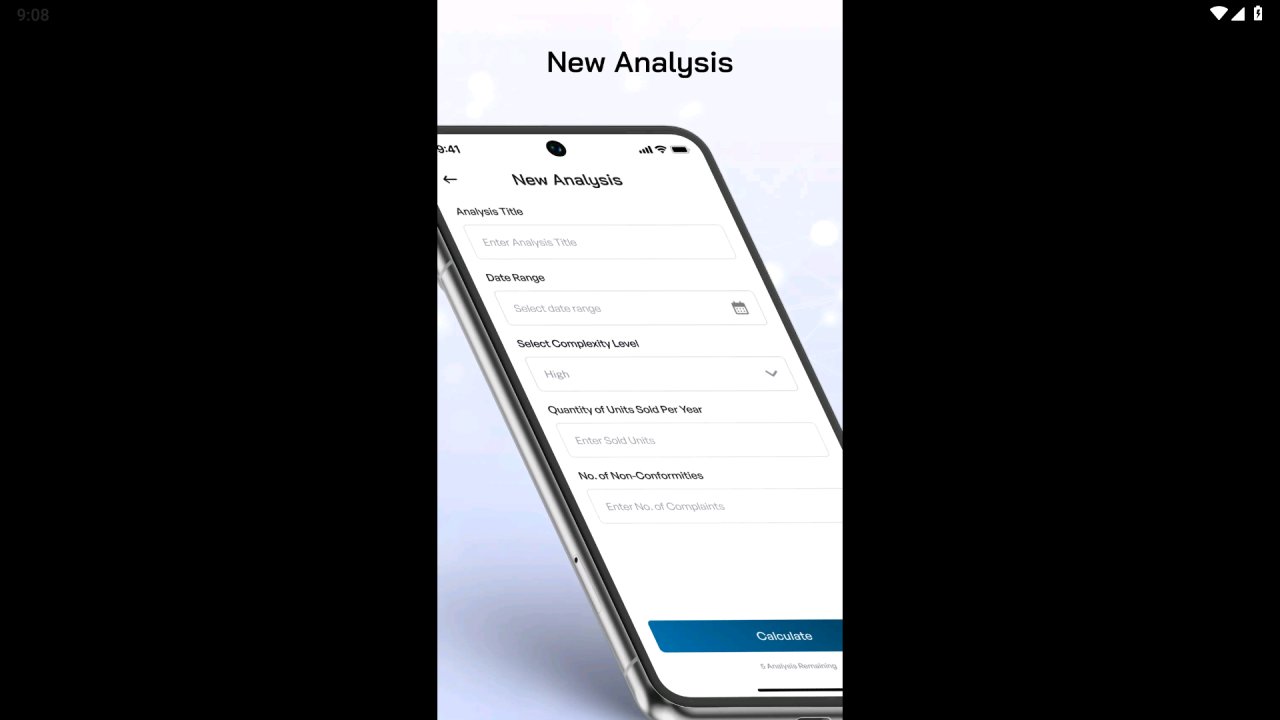
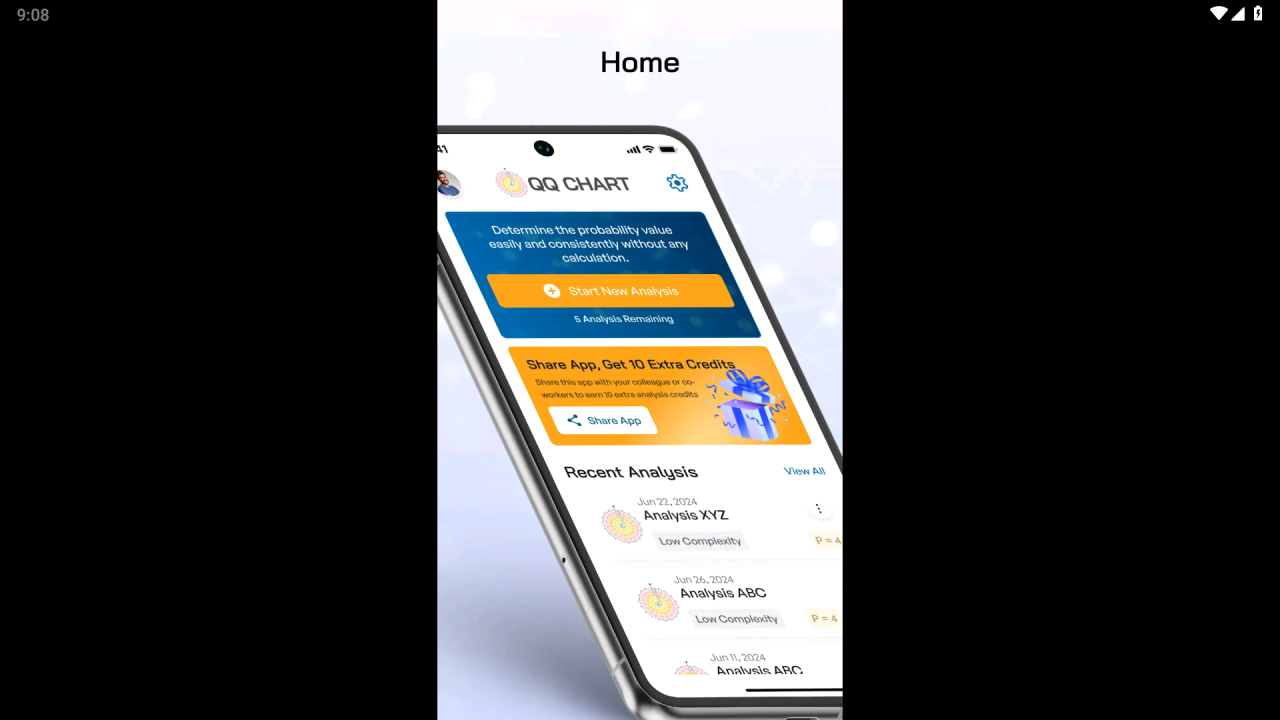
QQ chart easily converts quantitative probabilities to qualitative risk values
QQ Chart App is a tool used for converting the quantitative probability value obtained from the complaints or nonconformities in the form of percentage or decimal to the corresponding qualitative probability value of 1 through 5 set forth in the PHA (Preliminary Hazard Analysis), FMEA (Failure Mode and Effect Analysis) risk records.
Data safety
Safety starts with understanding how developers
collect and share your data. Data privacy and security practices may vary based
on your use, region, and age. The developer provided this information and may
update it over time.
Whats New
QQ chart easily converts quantitative probabilities to qualitative risk values
QQ Chart App is a tool used for converting the quantitative probability value obtained from the complaints or nonconformities in the form of percentage or decimal to the corresponding qualitative probability value of 1 through 5 set forth in the PHA (Preliminary Hazard Analysis), FMEA (Failure Mode and Effect Analysis) risk records.