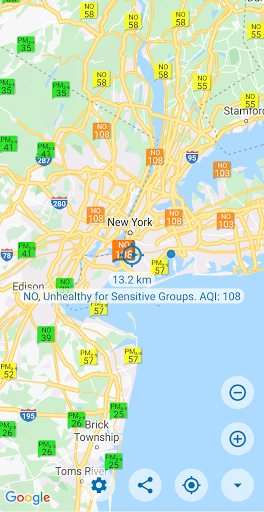
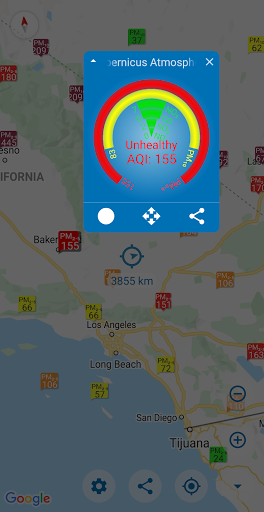
eAirQuality displays air quality index (AQI) from various sources: AirNow, Copernicus, ECMWF, etc.
The app displays concentrations of fine particulate matter PM10, coarse particulate matter PM2.5, nitrogen oxide NO, sulfur dioxide SO2, ozone O3 and other substances.
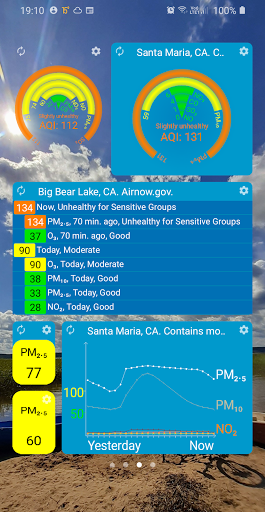
eAirQuality shows the current concentration of pollutants, a graph of changes over the last 24 hours and a forecast for several days ahead.
Air quality widgets allow you to see the AQI directly on your phone's home screen without having to launch a program.
AQI used in the app ranges from 0 to 500, with 0 representing ideally clean air and 500 representing the most polluted air.
Data safety
Safety starts with understanding how developers
collect and share your data. Data privacy and security practices may vary based
on your use, region, and age. The developer provided this information and may
update it over time.